-
분류 모델에 대한 성능 측정하기 (Model Evaluation)BIG DATA & AI 2022. 3. 27. 19:26반응형
분류 task에 대해서 열심히 분류 모델을 만들었다고 가정하자. 이 분류기-classifier-가 '잘' 만들어졌는지는 어떻게 판단할까?
본 포스팅에서는 confusion matrix를 이용한 model evaluation 방법만 다루고 있습니다. 그 외 auc-roc curve, logisitc loss 등 다양한 방법이 있습니다.
Confusion Matrix
Confusion matrix (혼동 행렬) 는 분류 모델의 성능을 측정하는 matrix 중 하나로, 가장 기본적인 형태를 띠고 있다.

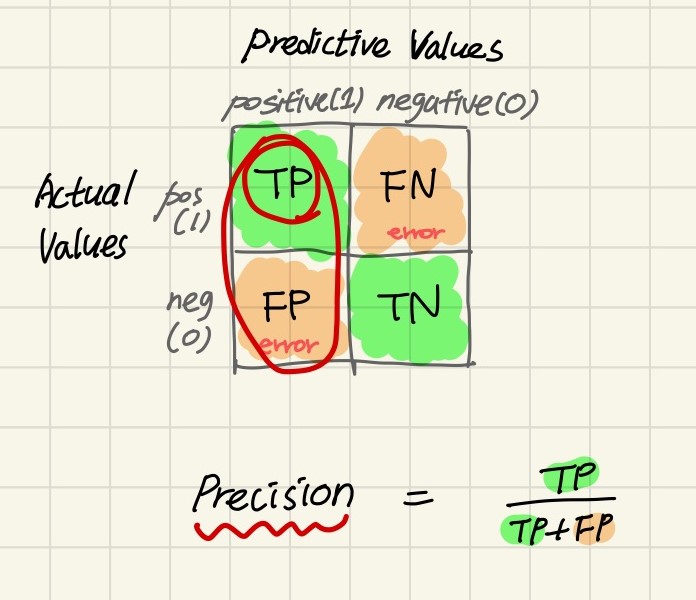
Confusion Matrix - TP (True-Positive) : 진짜 양성, 즉 positive로 예측했고 실제로 positive (True) 인 경우를 의미한다.
- FN (False-Negative) : 가짜 음성, 즉 negative로 예측했으나 실제로 positive (True) 인 경우를 의미한다.
- FP (False-Positive) : 가짜 양성, 즉 positive로 예측했으나 실제로 negative (False) 인 경우를 의미한다.
- TN (True-Negative) : 진짜 음성, 즉 negative로 예측했고 실제로 negative (False) 인 경우를 의미한다.
주의해야 할 점은, binary-classification 일 때는 위 사항을 쉽게 계산할 수 있으나 multi-classification task의 경우에는 기대값을 제외한 다른 클래스로 분류될 모든 경우에 대해서 false로 분류해야 한다.
예를 들자면, 'A', 'B' 그리고 'C'로 분류되는 multi-classification task가 있고 dataset이 X:Y 형식으로 {'a': 'A', 'b': 'B', 'c', 'C'} 라고 가정하고 class 'A'에 초점을 맞추면 ...
'a'를 인풋으로 넣었고 실제 결과값이 'A'인데 'A'로 분류된 경우 -> TP
'a'를 인풋으로 넣었고 실제 결과값이 'A'인데 'B'로 분류된 경우 -> FN
'b'를 인풋으로 넣었고 실제 결과값이 'B'인데 'A'로 분류된 경우 -> FP아래 그림을 보면, 위의 예처럼 'bird' class 내의 TP, FN, FP의 구성이 어떻게 되어 있는지 볼 수 있다.

Confusion Matrix (multi-class) 또한 confusion matrix는 Scikit-learn 라이브러리에서 from sklearn.metrics import confusion_matrix 함수를 import하여 그릴 수 있다.

Accuracy
Accuracy (정확도) in classification problems is the number of correct predictions made by the model over all kinds predictions made. 즉 모델이 결과를 올바르게 예측한 수치를 의미한다.

Accuracy score는 target variable이 거의 균등할때 사용하면 좋다고 한다.
Precision
Precision (정밀도) is defined as the number of true positives divided by the number of true positives plus the number of false positives. Precision is about being precise. 즉 모델이 예측한 결과가 얼마나 정확/정밀하냐의 수치이다.

Recall
When it is actually the positive result, how often does it predict correcly. Recall은 쉽게 말해 '재현율'이며, 실제 사건이 일어나는 케이스를 얼마나 맞췄는지에 대한 수치이다.

F1-score
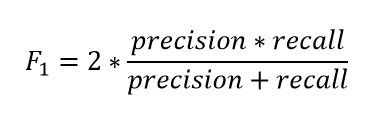
F1 score is the weighted average of Precision and Recall. Therefore, this score takes both false positives and false negatives into account.
Intuitively it is not as easy to understand as accuracy, but F1 is usually more useful than accuracy, especially if you have an uneven class distribution.마지막으로 f1-score evalutaion 방식이 있는데, precision과 recall에 대한 가중 평균 (weighted average) 을 계산하는 방법이다.

F1 score 이 측정 방법은 가중치를 적용하는 방법이기 때문에 데이터가 imblance할 때 사용하면 좋다고 한다.
References
https://deepinsight.tistory.com/173
[Model Evaluation] 분류 모델 평가 방법에 대해 알아보자 (Accuracy, precision, RecallROC, F1Score, AUC-ROC curve, l
본 포스팅은 Ouassim Adnane의 Kaggle Notebook 'Machine Learning Model Evaluation Metrics'를 기반으로 작성되었습니다. 단순히 이론은 학습하는 것이 아닌 실습을 통해 모델을 평가하는 연습을 충분히 갖는..
deepinsight.tistory.com
https://www.mariakhalusova.com/posts/2019-04-17-ml-model-evaluation-metrics-p2/
Maria Khalusova | Machine Learning Model Evaluation Metrics part 2: Multi-class classification
www.mariakhalusova.com
반응형'BIG DATA & AI' 카테고리의 다른 글
Deep Learning for Graphs: Naïve Approach부터 Graph Encoder, GIN까지 (1) 2022.08.30 GNN Overview 및 검색 엔진에 연결해 보기 (Predict Then Propagate: Graph Neural Networks Meet Personalized PageRank) (1) 2022.06.27 GAN (Generative Adversarial Network) (1) 2021.12.09 Web Crawling & Scraping 개념 (1) 2021.05.03 Big Data 분석 알기 쉽게 설명하기 (Easy to Understand Data Analytics with Cooking Recipe) (0) 2021.04.14